1 minute read
New Data Methodology for Air Service: Turning Real Search Behavior into Projected Demand PDEWs

Calculating Projected Demand PDEW
Airports using FlyMyAirport® now have a powerful new method to estimate market-level demand — using real consumer search behavior collected directly from their airport website.
FlyMyAirport captures destination-specific flight searches from travelers in real time. From this data, we calculate projected Demand PDEWs (Passengers Daily Each Way) using a straightforward, scalable formula:

This formula helps convert search interest into non-directional demand — giving airports a clear view of how many passengers are likely to travel each day to a specific destination, based on actual consumer behavior.
Connecting the Dots: Don’t Forget the Flow
Keep in mind: these PDEW projections are for final destinations. For hub airports, total demand may be much higher once connecting traffic is factored in.
Example: If you’re evaluating new service to DEN, start with the projected PDEW for Denver as the end destination. But don’t stop there. Add the projected PDEWs for one-stop destinations that would become more accessible from your airport through DEN. That gives airline planners a broader view of demand — helping you make the case: “This is how many people I can help you fill a plane to Denver with every day.”
Real-Life Example

TABLE A is a full year’s worth of data from an airport that subscribes to FlyMyAirport. (Note: Destination names and figures have been slightly altered to protect proprietary data.)
In this case, travelers performed over 240,000 flight searches on an airport’s website in the past year — an average of more than 20,000 searches per month.
To put it in context, this airport handles 400,000 to 500,000 annual passengers (non-directional average passengers for the year). That means the number of searches is about half the total passenger volume — making it a statistically meaningful sample. It gives the airport incredibly strong, quantitative insights into what travelers want and where real demand exists.
TABLE A: “Anonymous Airport XYZ”
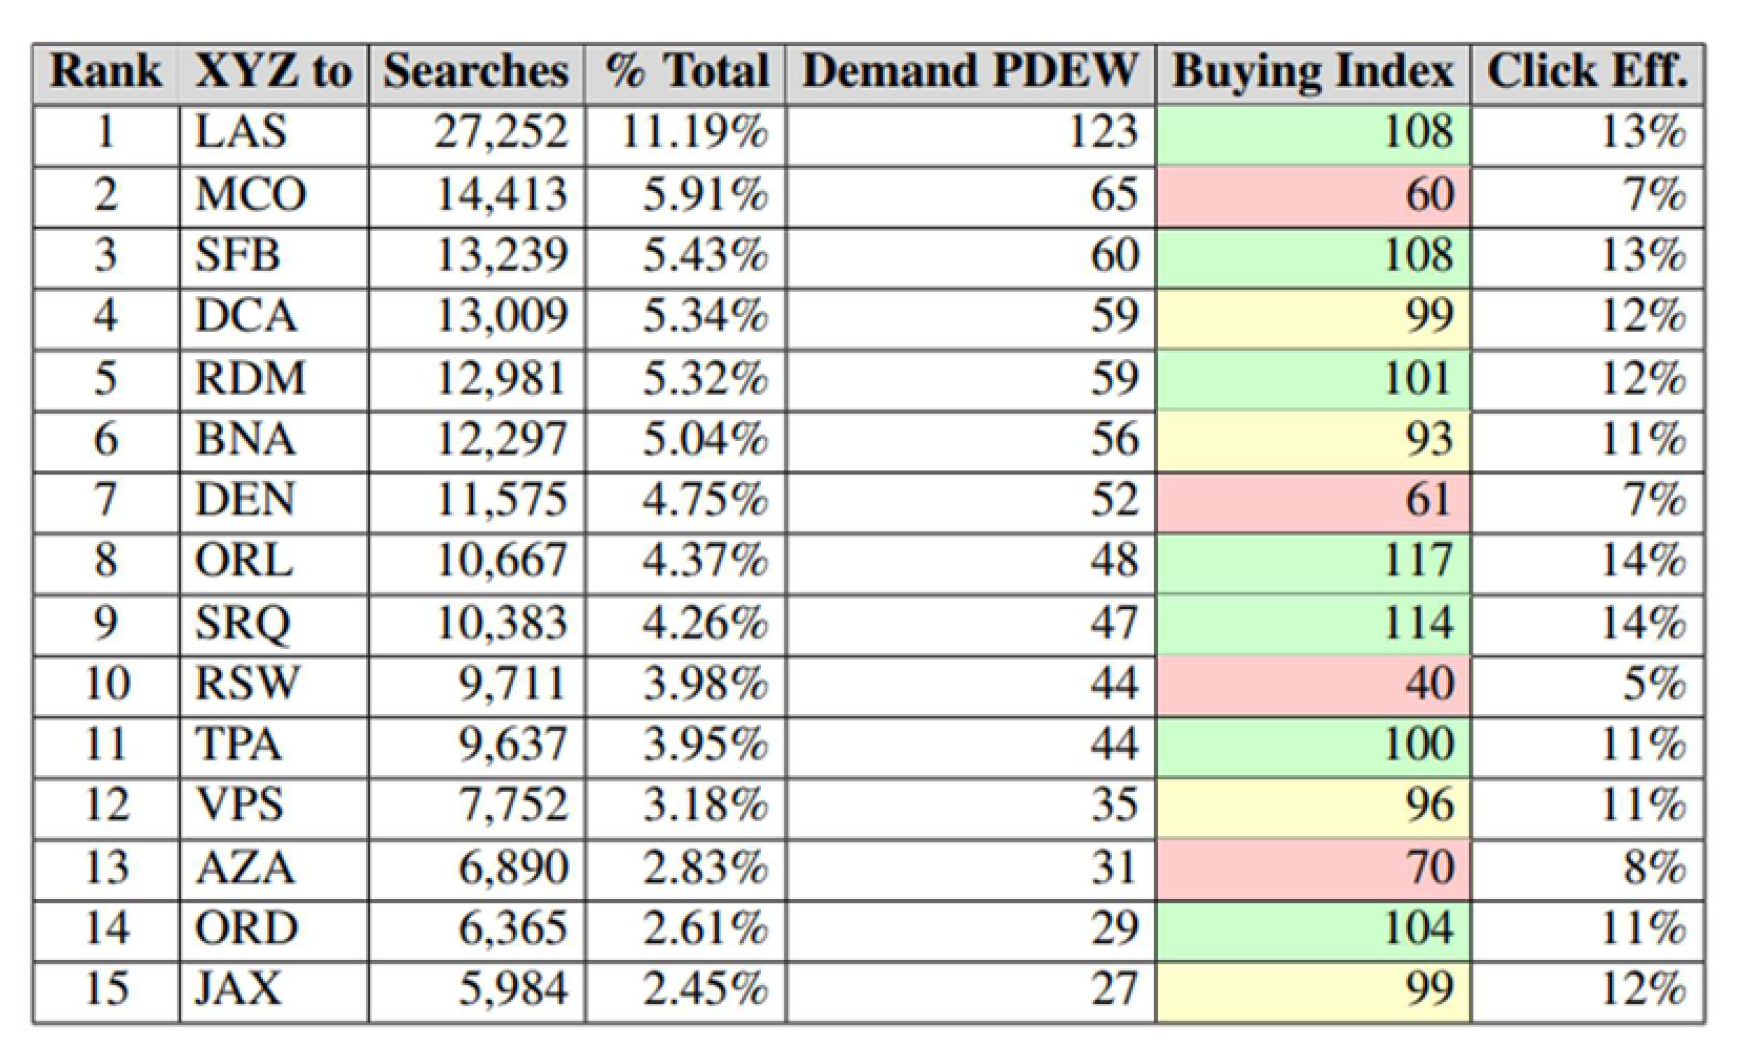
Layering in the Buying Index
To go even deeper, FlyMyAirport also tracks a Buying Index — a score that shows how often travelers add a flight to their shopping cart. It’s normalized to 100, representing the average provider click efficiency across all destinations.
- A low index might indicate service gaps: people want to go, but aren’t finding good flight options.
- A high index signals strong conversion and general consumer satisfaction with flight options.
Together, the Demand PDEW and Buying Index help airports identify not just demand — but whether current air service is converting that demand into more bookings.
For example, DEN as a destination for “Anonymous Airport XYX” shows a PDEW of 52 and a Buying Index of 61. But once flow-through traffic for relevant final destinations was added, the airport could confidently say to airlines: “Give us a Regional Jet for a Denver route, and we can fill it with 75 passengers per day.”
Why It Matters
This new methodology gives airports and airlines a fresh, data-backed view of demand—grounded in real, airport-specific search behavior. Airline consultants and network planners have responded enthusiastically. For many, it’s the first time they’ve seen demand projections built from an airport’s own consumer data. It’s not meant to replace O&D, T100 data or similar historical data sources. It’s a new layer of insight that brings the voice of the traveler into air service development.